The Catalyst Graveyard: What Happens to Biotech Stocks When Phase 3 Results Drop
By Steve Ouellette
On Friday, May 23, 2025, Prothena Corporation filed an 8-K with a single devastating sentence: the Phase 3 AFFIRM-AL trial for birtamimab in AL amyloidosis had failed, and the company was discontinuing development. The filing landed after market close. Memorial Day weekend sat in between. When the market reopened Tuesday morning, the stock opened at $4.58, down 30% from Friday's close of $6.58, on five times normal volume.
But the chart tells a more complex story. In the 90 days before the announcement, Prothena had already fallen 45% relative to the biotech index. The market had been quietly pricing in doubt for months. The 8-K confirmed the deadline rather than creating it. Half the value destruction happened before anyone read the press release.
Is this typical? Does every Phase 3 failure look like Prothena? And when a trial succeeds, do investors actually get rewarded?
We built a dataset of 1,476 Phase 3 clinical trial disclosures matched to SEC filings and stock prices to find out. The answers challenge the conventional wisdom at every turn.
Executive Summary
-
Phase 3 failures at small/mid-cap biotechs are catastrophic. Median stock decline of -33%, with 93% of events producing a >2% drop.
-
Positive Phase 3 results are not reliably bullish. Even when a trial meets its primary endpoint, the stock drops >2% in 63% of cases at small/mid-cap companies. Median return: -3.4%.
-
The "sell the news" pattern is real and measurable. 24% of positive-result events show a clear gap-up at market open followed by an intraday fade. Another 27% gap down despite the positive headline.
-
Only 4% of positive readouts produce a clean rally. Just 3 of 67 small/mid-cap events showed a gap-up-and-hold pattern. The remaining 45% opened flat.
-
The asymmetry is the trade. Holding through a Phase 3 readout at a small biotech has negative expected value regardless of outcome.
Methodology
Data Pipeline
-
Trial universe: 19,122 Phase 3 clinical trials extracted from ClinicalTrials.gov via the Solidus Platform pipeline.
-
Eligibility filter: 8,308 trials from publicly traded companies with definitive outcomes. Excluded non-outcome terminations (business decisions, COVID disruptions, enrollment issues).
-
SEC filing matching: Searched EDGAR for 8-K and 6-K filings in a window of -30 days to +6 months around each trial's primary completion date. Downloaded primary filing documents and EX-99.x exhibit press releases.
-
Text scoring: Scored each filing using proximity-weighted keyword matching (NCT ID, drug name, outcome language within 500 characters of the drug anchor). Rejected periodic financial reports.
-
Outcome classification: Classified events as positive, negative, mixed, or unknown using ClinicalTrials.gov why_stopped text, SEC filing text sentiment, and Claude Haiku LLM fallback for inconclusive matches.
-
Price data: Daily OHLCV from Massive.com. Event returns computed as max(|T+0|, |T+1|) to capture both intraday and after-hours disclosures. 90-day run-up benchmarked against XBI.
-
Market cap: Computed at event date as pre_event_close × shares_outstanding from the most recent SEC XBRL filing.
Filter Pipeline
| Stage | Count |
|---|---|
| Phase 3 trials (public companies) | 15,579 |
| With definitive outcome | 8,308 |
| Matched to SEC filing | 1,476 |
| High confidence match | 935 |
| With market cap data | ~170 |
| Small/mid-cap (<$10B) | 112 |
1. The Headline: Phase 3 Failure Is Catastrophic
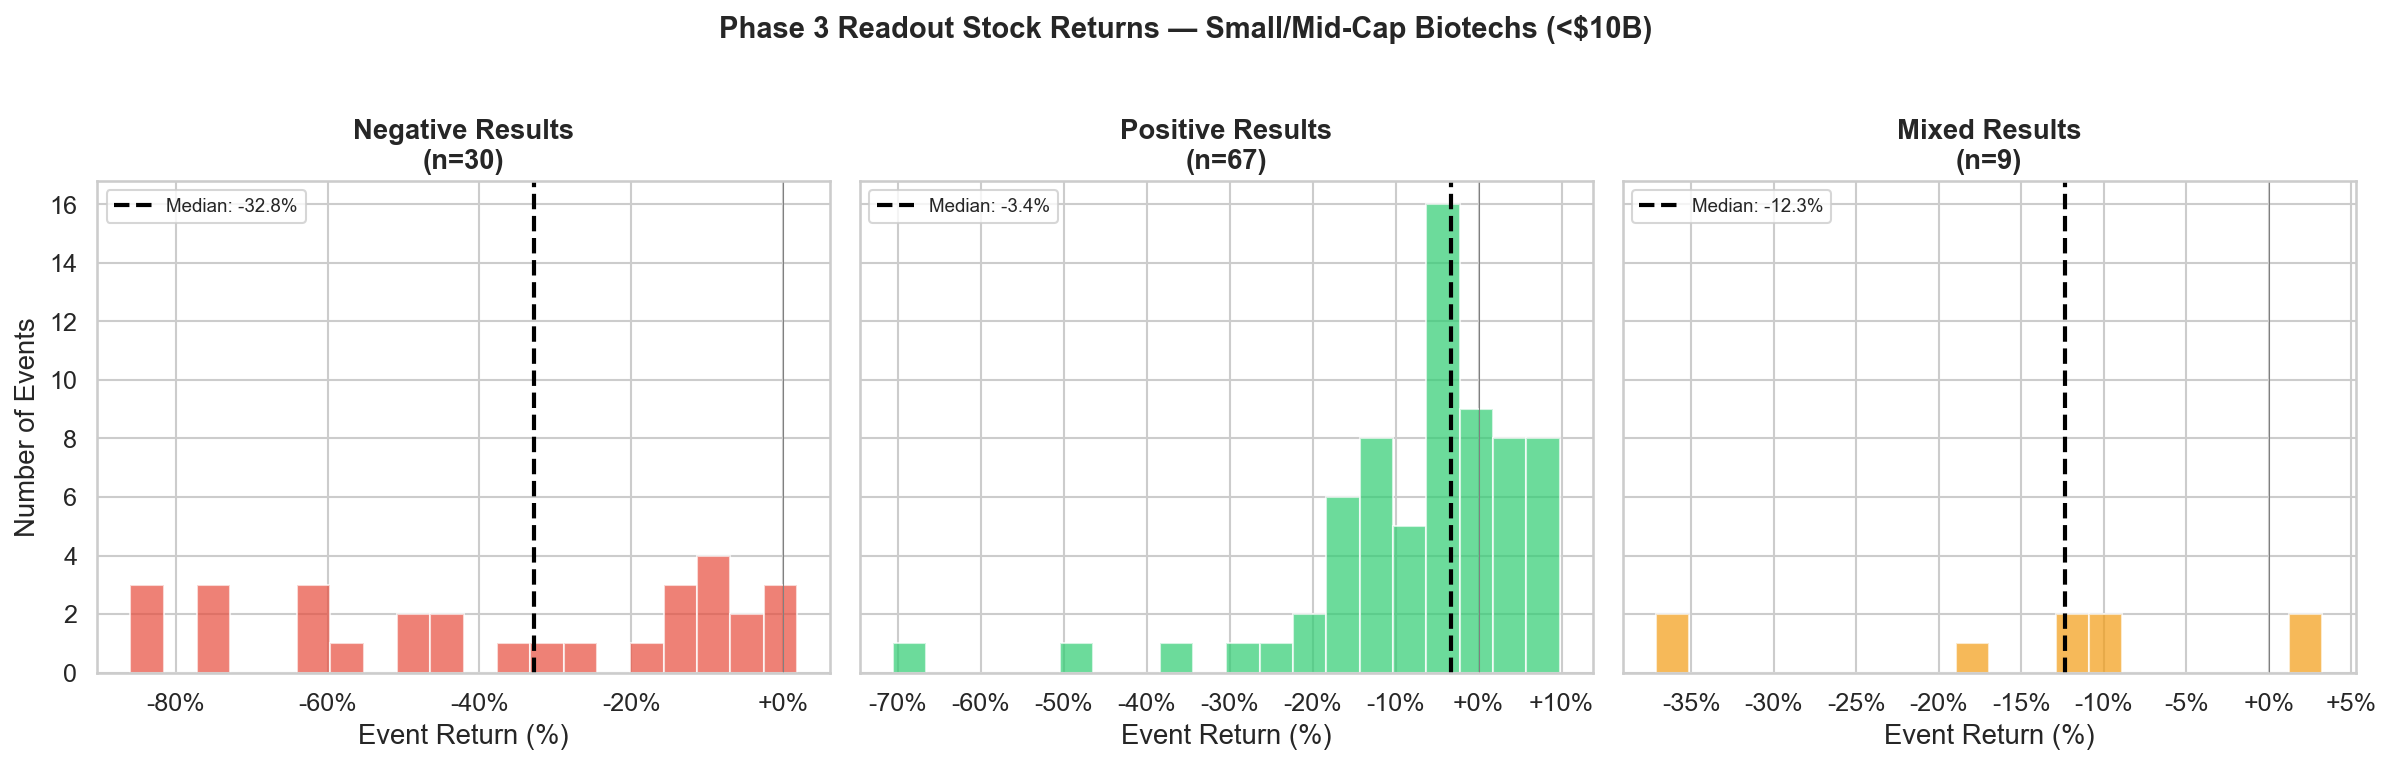 Figure 1: Phase 3 readout stock returns at small/mid-cap biotechs (<$10B market cap). Negative results cluster heavily to the left with a median -33% crash. Positive results are skewed negative with a median of -3.4%.
The distribution tells the story immediately. Negative results cluster heavily to the left and the typical outcome is a 33% crash. But even positive results are skewed negative, with most events clustered below zero.
The negative panel's near-uniform spread from -80% to 0% is striking: there is no "typical" failure magnitude. Some trials produce a -10% haircut; others wipe out 80% of the equity. In contrast, the positive panel is tightly clustered around -5% to +5%, a much narrower range, but still centered below zero.
Summary Statistics
| Outcome | N | Median Return | P(Drop >2%) | 95% CI | Worst | Best |
|---|---|---|---|---|---|---|
| Negative | 30 | -32.8% | 93% | 79% - 98% | -87% | +3% |
| Positive | 67 | -3.4% | 63% | 45% - 94% | -69% | +6% |
| Mixed | 9 | -12.3% | 78% | 51% - 73% | -36% | +5% |
Case Study: Prothena (PRTA) — AFFIRM-AL Failure, May 2025
Trial: NCT04973137 - Birtamimab for AL amyloidosis Event date: May 23, 2025 | Market cap: $353M
"Prothena Corporation plc issued a press release announcing results from the Phase 3 AFFIRM-AL clinical trial for birtamimab in patients with AL amyloidosis and the discontinuation of further development of birtamimab."
The 8-K was filed on a Friday. The market didn't react until Tuesday (Memorial Day weekend in between).
- T+0 (Friday): $6.58 (+0.5%) — filed after close, no reaction
- T+1 (Tuesday): $4.58 (-30.1%) on 9.65M shares (5x normal volume)
- 90-day run-up: -44.9% excess vs XBI. The stock had been bleeding for months and by the time the formal failure announcement came, half the value destruction had already happened through anticipatory selling.
Case Study: Acadia Pharmaceuticals (ACAD) — ADVANCE-2 Failure, March 2024
Trial: NCT04531982 - Pimavanserin for negative symptoms of schizophrenia Event date: March 11, 2024 | Market cap: $4.0B
Acadia is a mid-cap with an existing revenue base (Nuplazid for Parkinson's psychosis), but pimavanserin's expansion into schizophrenia was a key growth catalyst.
"...announced top-line results of the Company's Phase 3 ADVANCE-2 trial evaluating pimavanserin for the treatment of negative symptoms of schizophrenia. The study did not meet its primary endpoint..."
- T+0: $24.13 (+2.9%) — after-hours disclosure
- T+1: $19.98 (-14.8%) on 7.4M shares (4x normal)
At $4B market cap, this wasn't an existential failure — Acadia still had its base business. But the market repriced the pipeline optionality, producing a -15% decline rather than the -80% crashes seen at single-asset companies.
Case Study: Trevi Therapeutics (TVRD) — KOURAGE-1, June 2024
Trial: NCT05978063 - Oral difelikefalin for notalgia paresthetica Event date: June 12, 2024
"...announcing the outcome from the dose-finding Part A of the KOURAGE-1 study evaluating the efficacy and safety of oral difelikefalin for moderate-to-severe pruritus in adult patients with notalgia paresthetica."
The why_stopped text was direct: "oral difelikefalin did not demonstrate a meaningful clinical benefit."
- T+0: $24.48 (+2.6%) — another after-hours disclosure
- T+1: $15.98 (-33.0%)
This case perfectly illustrates the T+0/T+1 timing pattern. The filing hit EDGAR during trading hours but the actual press release went out after close. Using T+0 alone would have shown a +2.6% "gain" for a trial failure.
2. The Surprise: Positive Results Don't Mean Positive Returns
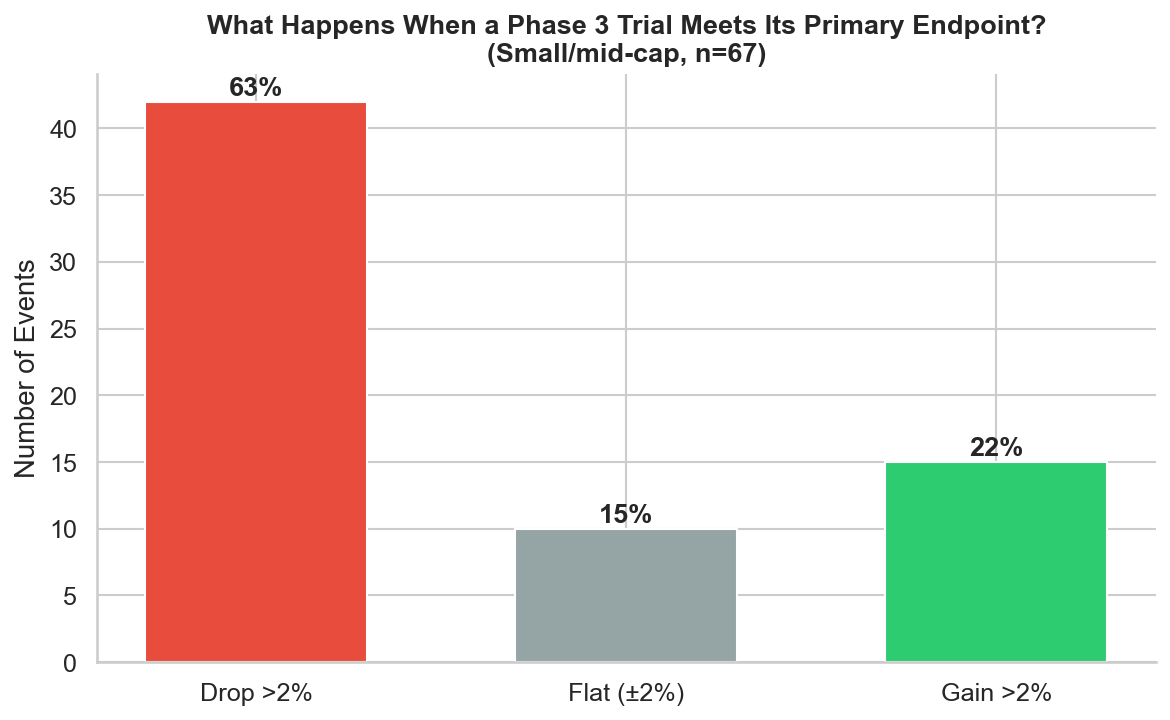 Figure 2: Distribution of stock reactions to positive Phase 3 results at small/mid-cap biotechs. The stock drops >2% in 63% of cases. Only 22% produce a meaningful gain.
This is the finding that surprises everyone outside biotech. When a Phase 3 trial meets its primary endpoint at a small or mid-cap company, the stock drops more than 2% nearly two-thirds of the time. Only 22% of events produce a meaningful gain. The median return is -3.4%.
The intuition that "positive results = stock goes up" treats clinical trials as binary pass/fail events. The market doesn't. By the time a Phase 3 readout drops, the market has already formed detailed expectations about effect size, secondary endpoints, safety profile, competitive positioning, and commercial potential. A trial that "meets its primary endpoint" can still disappoint on every other dimension.
Three mechanisms drive this pattern:
The expectations gap. A positive result confirms what the market hoped for — but hope was already priced in. Small/mid-cap biotech stocks routinely run up 30–80% in the months before a readout as event-driven capital accumulates. A "positive" result that merely meets the bar doesn't justify the premium already built into the stock. The market needed a blowout; it got a pass.
The data quality spectrum. "Positive topline data" is a press release label, not a scientific assessment. A trial can meet its primary endpoint with a p-value of 0.049 and a clinically marginal effect size. The market reads the actual numbers — hazard ratios, confidence intervals, secondary endpoint performance, subgroup analyses — before the bell rings. When the data is positive-but-underwhelming, the stock gaps down at the open despite the upbeat headline.
Catalyst selling. Event-driven traders accumulate positions in the weeks and months before a binary readout, intending to sell into the liquidity created by the announcement. When results drop, these holders exit regardless of outcome. The resulting selling pressure overwhelms any incremental buying from investors who read the headline and decide to get in. The readout itself is the exit event, not the entry event.
The practical implication is that correctly predicting a Phase 3 success is not sufficient to profit from holding through the readout. You also need to predict that the data will exceed the market's already-elevated expectations — a materially harder problem.
3. Dissecting the Selloff: Gap-and-Fade vs. Gap Down
When a positive Phase 3 result drops the stock, what does the intraday pattern look like? We decomposed the day-of reaction into the pre-market gap (previous close to open) and the intraday move (open to close), and classified each event into one of four patterns:
Gap Down (27%): The stock opens below the previous close (gap < -1%) despite the positive headline. The market reads the actual data pre-market and disagrees with the press release framing.
Flat Open (45%): The stock opens within ±1% of the previous close. The pre-market reaction is muted or ambiguous — the headline is positive but the market hasn't decided how to interpret the data.
Gap Up + Fade (24%): The stock gaps up at the open on the positive headline, then fades through the session. Classic catalyst selling: event-driven traders exit into the liquidity created by headline buyers.
Gap Up + Hold (4%): The stock gaps up and holds or extends gains through the close. This is a genuinely positive market reaction. Just 3 of 67 events showed this pattern.
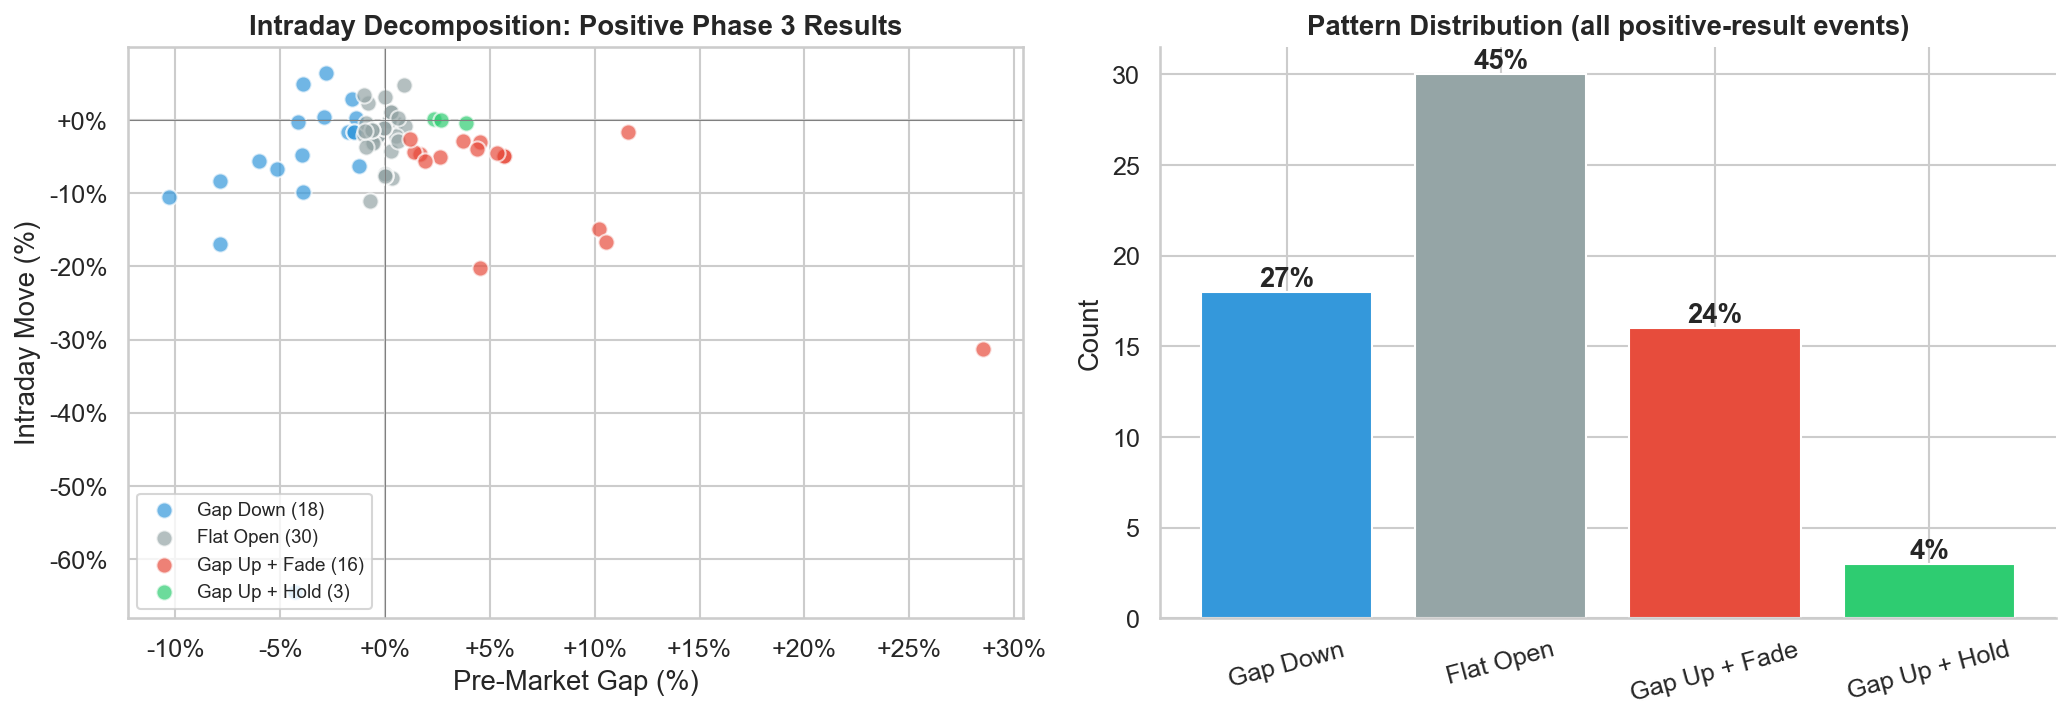 Figure 3: Scatter plot of pre-market gap vs. intraday move (left) and distribution of intraday reaction patterns (right). Only 4% of positive Phase 3 readouts produce a clean rally that holds through the session.
Case Study: Iterum Therapeutics (ITRM) — The Gap-and-Fade, January 2024
Trial: NCT05584657 - Sulopenem for uncomplicated UTIs Event date: January 30, 2024 | Market cap: $80M | 90-day run-up: +111%
- Previous close: $1.79
- Open: $2.30 (+28.5% gap up on the headline)
- Close: $1.58 (-31.3% intraday fade)
- Net: -14.0% | Volume: 24.5M shares (50x normal)
The purest expression of catalyst selling: the stock gapped up nearly 30% at the open, then collapsed through the session on massive volume, closing below the previous day's close. A 110% run-up into a readout means the market has already priced in most of the positive scenario. The announcement merely confirms what was expected — and the holders who were waiting for the catalyst take their profits.
Case Study: NewAmsterdam Pharma (NAMS) — "Positive Topline Data," Down 16%, November 2024
Trial: NCT06005597 - Obicetrapib for hypercholesterolemia Event date: November 20, 2024 | Market cap: $2.7B | 90-day run-up: +50.2%
"...today announced positive topline data from the Company's Phase 3 TANDEM clinical trial."
- Previous close: $23.68
- Open: $21.82 (-7.9% gap down)
- Close: $20.01 (-8.3% further intraday decline)
- Net: -15.5%
The stock didn't even gap up on the positive headline. The market read the actual data and concluded that "positive topline" wasn't positive enough given the 50% run-up and competitive positioning against Leqvio and PCSK9 inhibitors.
Case Study: KalVista Pharmaceuticals (KALV) — Positive Results, Stock Down 10%, February 2024
Trial: NCT05259917 - KVD900 for hereditary angioedema Event date: February 13, 2024 | Market cap: $811M | 90-day run-up: +77.6%
- Previous close: $16.04
- Open: $15.84 (-1.2% gap down)
- Close: $14.85 (-6.2% intraday fade)
- Net: -10.2%
At +78% run-up, the market needed a blowout result to justify the current price. A merely "positive" result wasn't sufficient.
4. The Run-Up: Was the Failure Already Priced In?
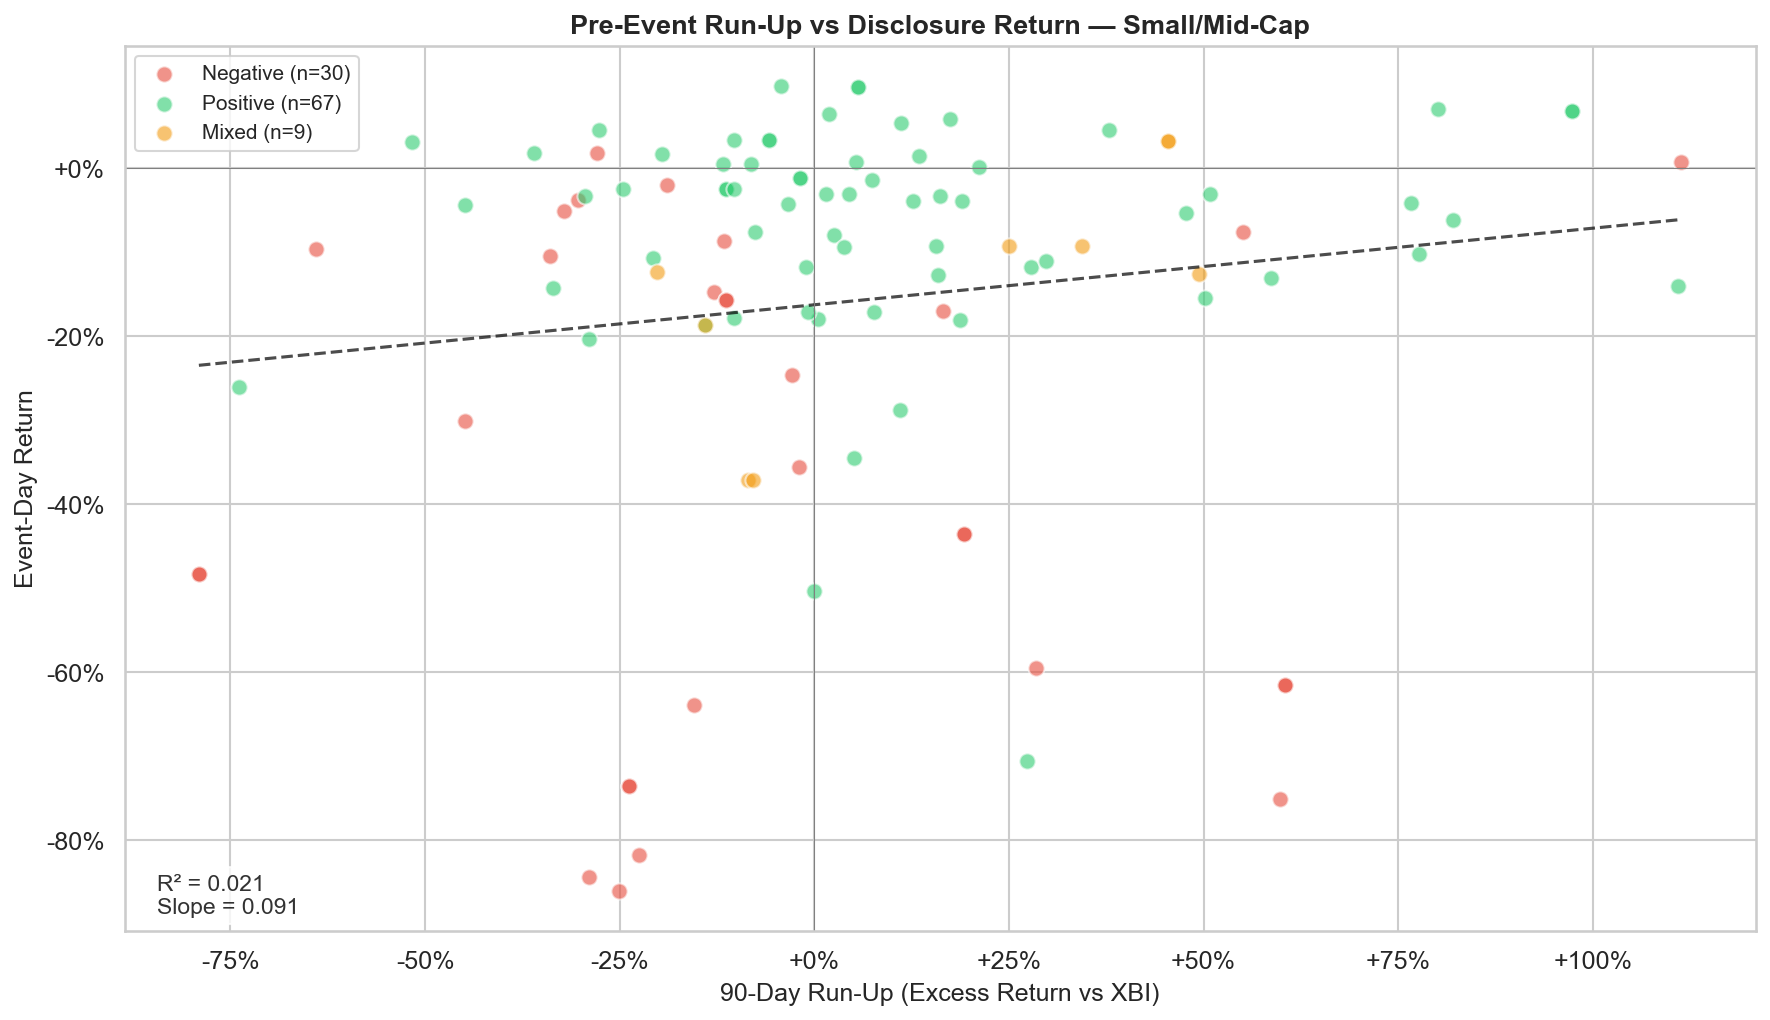 Figure 4: 90-day excess return (vs. XBI) plotted against event-day return for small/mid-cap biotechs. R² = 0.021 — pre-event price movement explains just 2% of the variance in readout reactions.
The run-up data complicates the "priced for perfection" narrative. There's no clean linear relationship between how much a stock ran up before the readout and how much it fell after. Some of the worst crashes (PRTA -30%, AKBA -71%) had significant negative run-ups; the market was already pessimistic and the failure confirmed it. Others had massive positive run-ups that unwound completely.
The regression line confirms this quantitatively: R² = 0.021, meaning the 90-day excess return explains just 2% of the variance in event-day returns. The slope is slightly positive (0.091) but statistically insignificant. Pre-event price movement does not reliably predict readout reaction.
This matters for position sizing and strategy selection. If pre-readout price action were predictive, you could use it to filter which catalysts to trade. It isn't, so you can't. A stock that has run up 100% is not systematically more likely to crash on positive data than one that has been flat — both ITRM (+111% run-up, -14% on positive data) and PRTA (-45% run-up, -30% on negative data) demonstrate this. The catalyst outcome and the market's reaction to it are largely independent of the pre-event trend.
5. Market Cap Matters: The Smaller the Company, the Bigger the Move
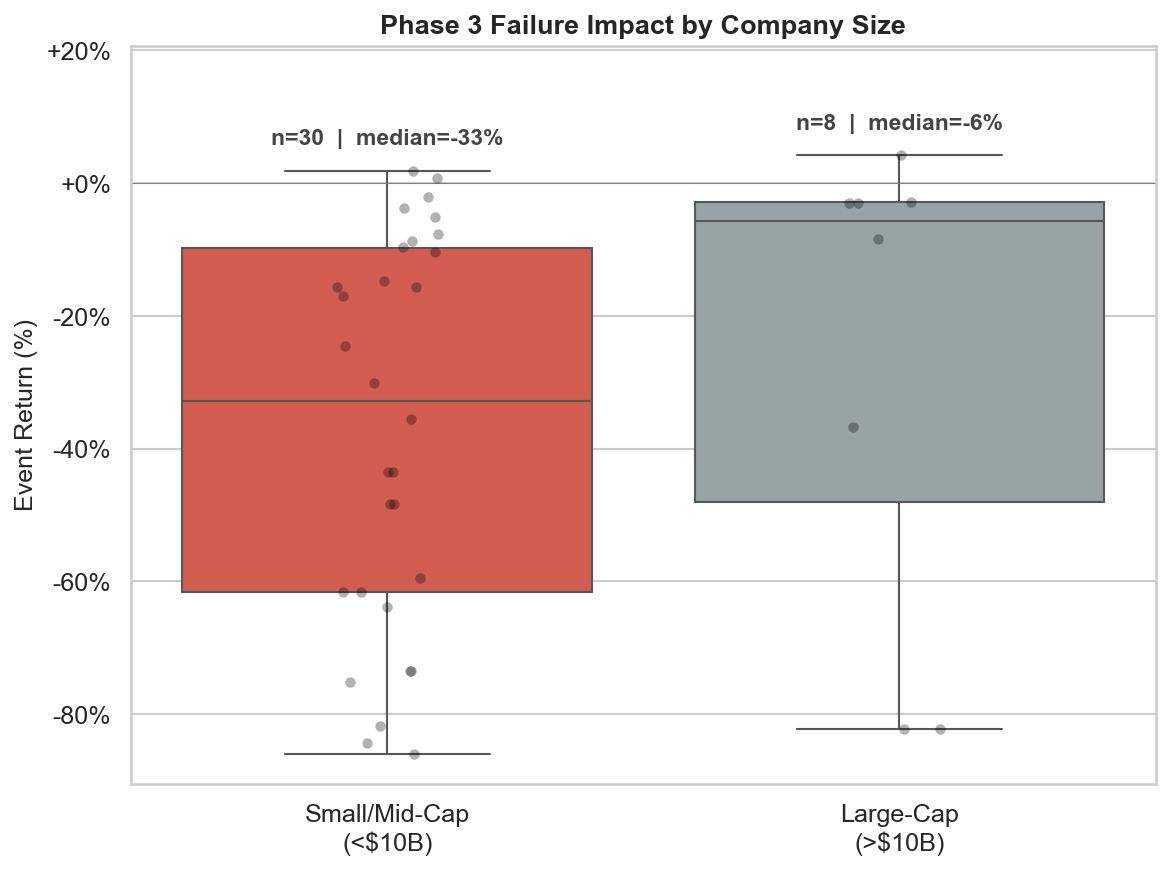 Figure 5: Event return distributions for Phase 3 failures by market cap bucket. Small/mid-cap (<$10B) median = -33% vs. large-cap (>$10B) median = -6%.
With small sample sizes at finer market cap gradations, we collapse to two buckets where the signal is clean: small/mid-cap (<$10B, median = -33%) vs. large-cap (>$10B, median = -6%). The strip plot overlays individual data points to show the full distribution behind each box.
Market cap is a proxy for pipeline diversification and existential risk. A $350M company losing its lead asset faces potential liquidation. A $4B company loses a growth option. A $200B company barely notices. For traders, this means the short thesis on Phase 3 readouts only works at small/mid-cap, where the clinical outcome is genuinely binary for the equity.
Market Cap as a Proxy for Existential Risk
| Company | Market Cap | Drug | Return | What Happened |
|---|---|---|---|---|
| Prothena (PRTA) | $353M | Birtamimab | -30.1% | Single-asset, lead program failed |
| Acadia (ACAD) | $4.0B | Pimavanserin | -14.8% | Mid-cap, base business intact |
| AstraZeneca (AZN) | >$200B | Baxdrostat | -1.1% | Mega-cap, rounding error |
6. Timing: When Does the Market React?
54% of the time, the largest move happens on the day after the 8-K filing date — T+1, not T+0. This reflects the standard biotech playbook: companies announce results via press release after market close, the 8-K hits EDGAR that evening or the next morning, and the stock reacts at the next open.
This is why our event return metric uses max(|T+0|, |T+1|) rather than T+0 alone. Using filing-day close would miss the actual reaction in more than half of events. The Prothena and Trevi case studies above illustrate this pattern clearly: both showed modest positive T+0 returns followed by -30% and -33% crashes at T+1.
The Anticipation Window
The 90-day excess return data reveals that the market's reaction to a Phase 3 readout begins weeks or months earlier. The run-up window itself is evidence of anticipation: capital flows into (or out of) a stock as the expected readout date approaches and event-driven funds build positions, sell-side catalyst calendars flag upcoming dates, and options market activity signals institutional interest. The run-up data confirms anticipation exists, but does the timing and direction of that anticipation contain a tradeable signal?
Our data suggests the answer is nuanced. The R² of 0.021 between 90-day run-up and event-day return confirms that the magnitude of the run-up doesn't predict the magnitude of the reaction. But the run-up itself tells you something important: it tells you that the market is aware of the catalyst and has already begun to price a scenario. A stock that has run up 80% into a readout has attracted speculative capital that will need to exit regardless of the outcome. A stock that has bled 40% into a readout has seen that capital leave early, often because clinical or competitive signals deteriorated ahead of the formal data release.
The timing of when the run-up begins may be more informative than its magnitude. Stocks that spike in the final 5–10 days before a readout, often coinciding with options market activity and social media chatter, are more likely exhibiting retail-driven speculation than informed positioning. Stocks that drift steadily upward over 60–90 days may reflect institutional accumulation by funds with a genuine analytical view on the trial's probability of success. We don't yet have the intra-window granularity to test this hypothesis rigorously, but it points toward a follow-up analysis: decomposing the 90-day window into early accumulation (days -90 to -30), mid-period positioning (days -30 to -10), and late-stage speculation (days -10 to 0), and testing whether the slope and timing of capital inflows predict either the outcome or the market's reaction to it.
What we can say with confidence is this: by the time an 8-K hits EDGAR, the event is not news to the market. The anticipation window's direction, timing, and composition might be where a lot of the real information lives.
7. Implications for Trading Phase 3 Catalysts
The Core Asymmetry
At small/mid-cap biotechs, Phase 3 readouts are asymmetrically negative events:
| Outcome | Median Return | P(Drop >2%) |
|---|---|---|
| Negative | -32.8% | 93% |
| Mixed | -12.3% | 78% |
| Positive | -3.4% | 63% |
The expected value of holding through a Phase 3 readout is negative regardless of outcome. Even if you correctly predict that a trial will succeed, the most likely outcome is still a modest decline.
Trading Strategies Implied
-
The vol-selling temptation (and its problem). The data suggests selling straddles into positive readouts should be profitable — the market overestimates upside and positive results produce small moves. But the strategy requires being short the downside tail too: a 30–80% overnight gap on a failure would wipe out months of premium collection. At small-cap biotech implied volatilities (often 80–120%), the premium may not compensate for the tail. This strategy is more interesting at mid-caps with diversified pipelines, where failure drawdowns are capped in the -10% to -20% range, but the sample size here is too small for high-confidence backtesting.
-
Buy the gap-down on positive results. 27% of positive-result events gap down at the open. If the data is genuinely strong (large effect size, clean p-value, robust secondary endpoints), the initial selloff may reverse over days or weeks as the market re-evaluates. This requires reading the actual clinical data, not just the headline.
-
Sell into the gap-up. 24% of positive-result events show the gap-and-fade pattern. If you're long going into a readout and the stock gaps up, taking profits at the open has historically been the right move. Only 4% of events held their gains through the session.
-
The pre-announcement signal is weak. 90-day run-up doesn't predict readout reaction reliably (R² = 0.02). Don't use pre-readout price action as a primary trading signal.
Limitations
-
Sample size at small-cap: 30 negative events, 67 positive events with market cap data. Sufficient for directional conclusions but not for high-confidence strategy backtesting.
-
Outcome classification: Our classifier uses keyword matching + LLM, not manual expert review. ~10% of events remain unclassified.
-
Market cap filtering: ~55% of high-confidence events lack SEC XBRL shares data (mostly foreign filers). The market cap filter may systematically exclude certain company types.
-
Survivorship bias: Tickers that delisted after a Phase 3 failure may not appear in SEC's current ticker-to-CIK mapping.
Disclaimer: The content of this blog post is for informational and educational purposes only and does not constitute financial advice, investment recommendations, or a solicitation to buy or sell any securities. The analysis presented reflects historical trends in biotechnology stock price reactions to clinical trial disclosures and should not be relied upon as a basis for making investment decisions. Past performance is not indicative of future results. Readers should consult a qualified financial advisor before making any investment decisions. Solidus Bio assumes no liability for any actions taken based on the information presented herein.
Data pipeline: Solidus Platform. Clinical trial data: ClinicalTrials.gov. SEC filings: EDGAR. Price data: Massive.com. Outcome classification: keyword matching with Claude Haiku LLM fallback.
Need a custom competitive, IP, or diligence review for your team?
Solidus Bio delivers analyst-grade research for biotech companies and investors making high-stakes decisions.
Book a Scoping Call