The Catalyst Graveyard Part 2: What Happens After a Phase 3 Failure?
By Steve Ouellette
In Part 1, we showed that Phase 3 failures are brutal for small- and mid-cap biotech stocks: the median event produced a 33% decline, and 93% of failures led to a material drop. But the crash is only the start of the story. What happens in the 18 months after the failure?
We tracked 25 small- and mid-cap biotechs through the 18 months after a Phase 3 failure, using SEC filings to reconstruct each company's post-failure timeline: restructurings, capital raises, strategic reviews, and pipeline pivots.
Key findings:
-
76% of companies pivoted. In this sample, the dominant post-failure path was restructuring and reinvention: cutting costs, raising capital, and advancing backup programs rather than shutting down immediately.
-
No immediate fire sale. In our sample, zero companies were acquired within 18 months of a Phase 3 failure. The post-crash bargain hunting narrative did not show up in the data; acquirers appeared to wait for companies to stabilize or rebuild value first.
-
Cash runway strongly shaped the path. In this dataset, companies with very short runway were more likely to face distressed financing or liquidation, while those with 12 or more months generally had more room to execute a deliberate pivot. The two liquidations in the sample had the most pressured runway profiles.
-
Companies acted quickly. The median time to first corporate action, whether a restructuring, strategic review, or capital raise, was about 30 days. The post-failure response usually began within the first month.
1. The Dataset and the Four Paths
We started with the ~30 small- and mid-cap Phase 3 failure events from Part 1: companies with market caps under $10 billion that experienced a definitive negative clinical trial outcome matched to a high-confidence SEC filing. After removing same-day duplicates (multiple trials failing on the same date for the same company), we had 25 distinct failure events across 21 unique companies.
For each company, we used the SEC EDGAR submissions API to retrieve every filing in the 18-month window after the failure: 8-K current reports, 10-Q quarterly financials, DEFM14A merger proxies, and SC 13D/13G beneficial ownership filings. We classified each 8-K into corporate event categories (strategic alternatives, restructuring/RIF, management changes, M&A/licensing, liquidation signals, capital raises, and pipeline pivots) using LLM-primary classification with keyword confidence boosting. This analysis captures disclosed corporate actions visible in SEC filings, not every internal or informal strategic move. "No action" therefore means no material action surfaced through our filing-based lens.
From the first 10-Q filed after each failure, we extracted cash and short-term investments from SEC XBRL data and computed quarterly operating burn to estimate cash runway at the time of failure.
Every company landed on one of four paths:
| Path | Count | Description |
|---|---|---|
| Pivoted | 19 (76%) | Cut costs, raised capital, advanced backup programs |
| Liquidated | 2 (8%) | Ran out of cash, wound down operations |
| Zombie | 2 (8%) | Sat on cash, took no meaningful action |
| In Process | 2 (8%) | Too recent to classify, still unresolved |
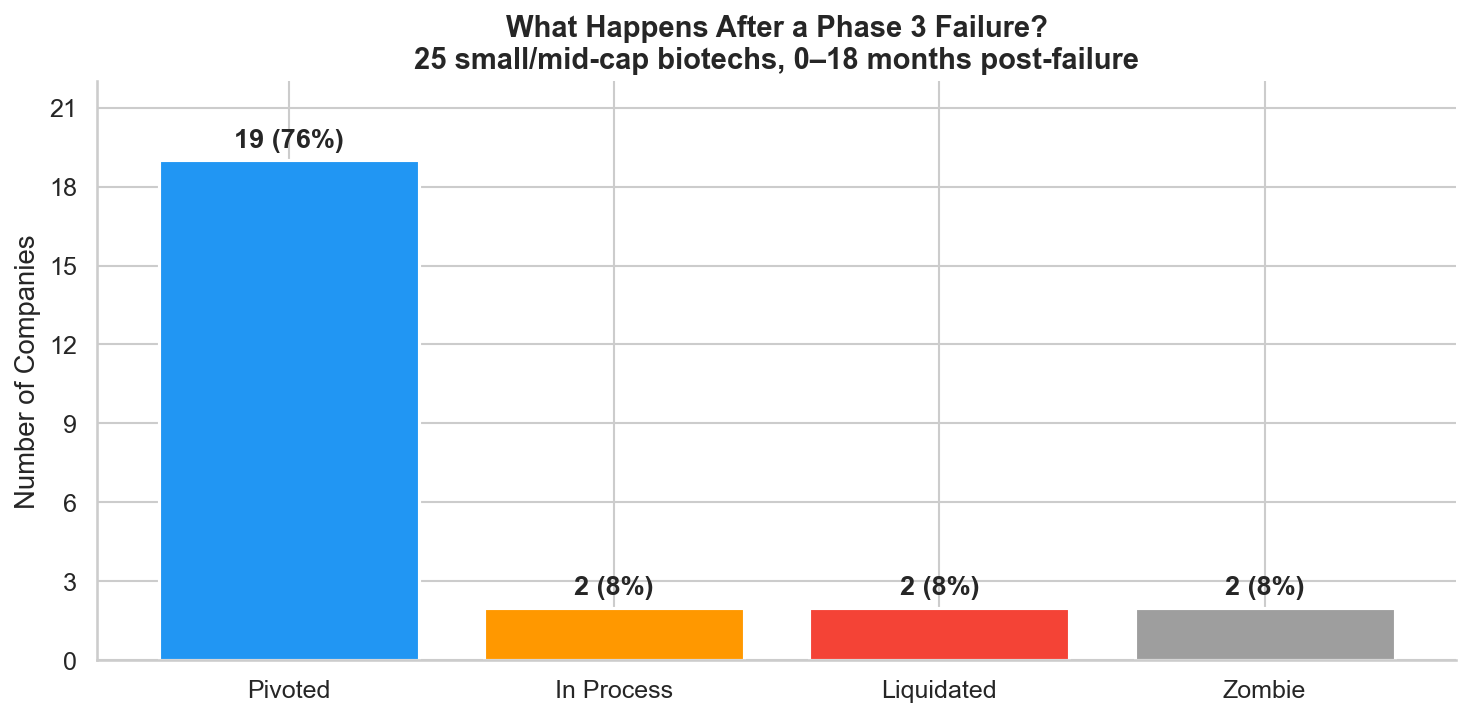 Figure 1: Post-failure outcomes for 25 small/mid-cap biotechs in the 18 months following a Phase 3 failure. Three out of four companies pivoted.
The result is striking: three out of four companies pivot. The biotech graveyard narrative, that Phase 3 failure means the company is done, doesn't match the data. Most companies restructure, find new programs, and keep going. Whether they ultimately succeed is a different question, but the immediate post-failure period is defined by action, not capitulation.
2. Cash Runway Shapes the Post-Failure Path
If most companies pivot, what determines which ones can't? Cash runway at the time of failure is the clearest predictor.
We computed runway as total liquidity (cash plus short-term investments) divided by quarterly operating burn, using data from the first 10-Q filed after the failure. This is a crude metric. It doesn't account for post-RIF burn reduction, pending milestones, or capital raises. But it captures the company's starting position.
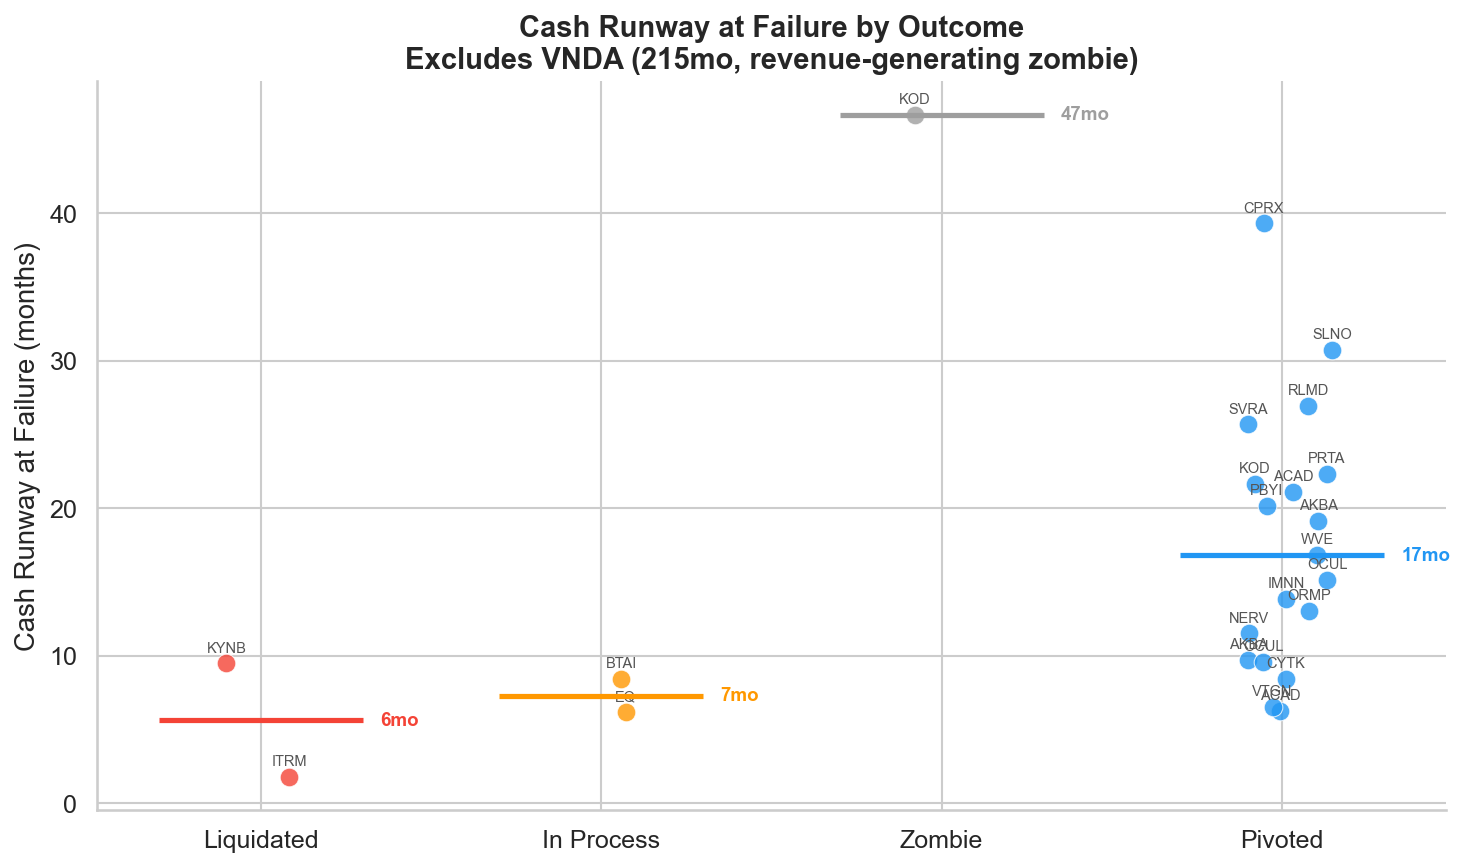 Figure 2: Cash runway (months) at the time of failure, grouped by post-failure outcome. Excludes VNDA (215 months, revenue-generating zombie). Companies with very short runway were more likely to face distress or liquidation.
The two liquidated companies, ITRM (Iterum Therapeutics) and KYNB (FibroGen/Kyntra Bio), sit at the left edge of the chart. ITRM had just 1.8 months of runway: $12 million in cash against a $21 million quarterly burn. Within two days of the failure, they announced they were "evaluating corporate, strategic and financial alternatives," code for "we're running out of options." KYNB had a paradoxically large cash pile ($336 million including short-term investments) but was burning $106 million per quarter, giving them only 9.5 months. The burn rate, not the absolute cash position, drove the outcome.
The zombie companies, KOD (Kodiak Sciences) and VNDA (Vanda Pharmaceuticals), sit at the opposite extreme. KOD had $672 million in cash and 47 months of runway after their -82% crash. VNDA's revenue base, HETLIOZ (tasimelteon) and Fanapt (iloperidone), meant the company could sit indefinitely with 215 months of runway. Both companies took essentially no corporate action in the 18 months following failure.
The pivoted companies span the middle: median runway of 17 months, ranging from 6 months (ACAD's 2018 failure) to 39 months (CPRX). The dividing line isn't sharp, but the pattern is clear. Companies with less than roughly 6 months of runway at failure face existential pressure that limits their options. Companies with more than 12 months have time to restructure deliberately.
3. How Companies Act After Failure
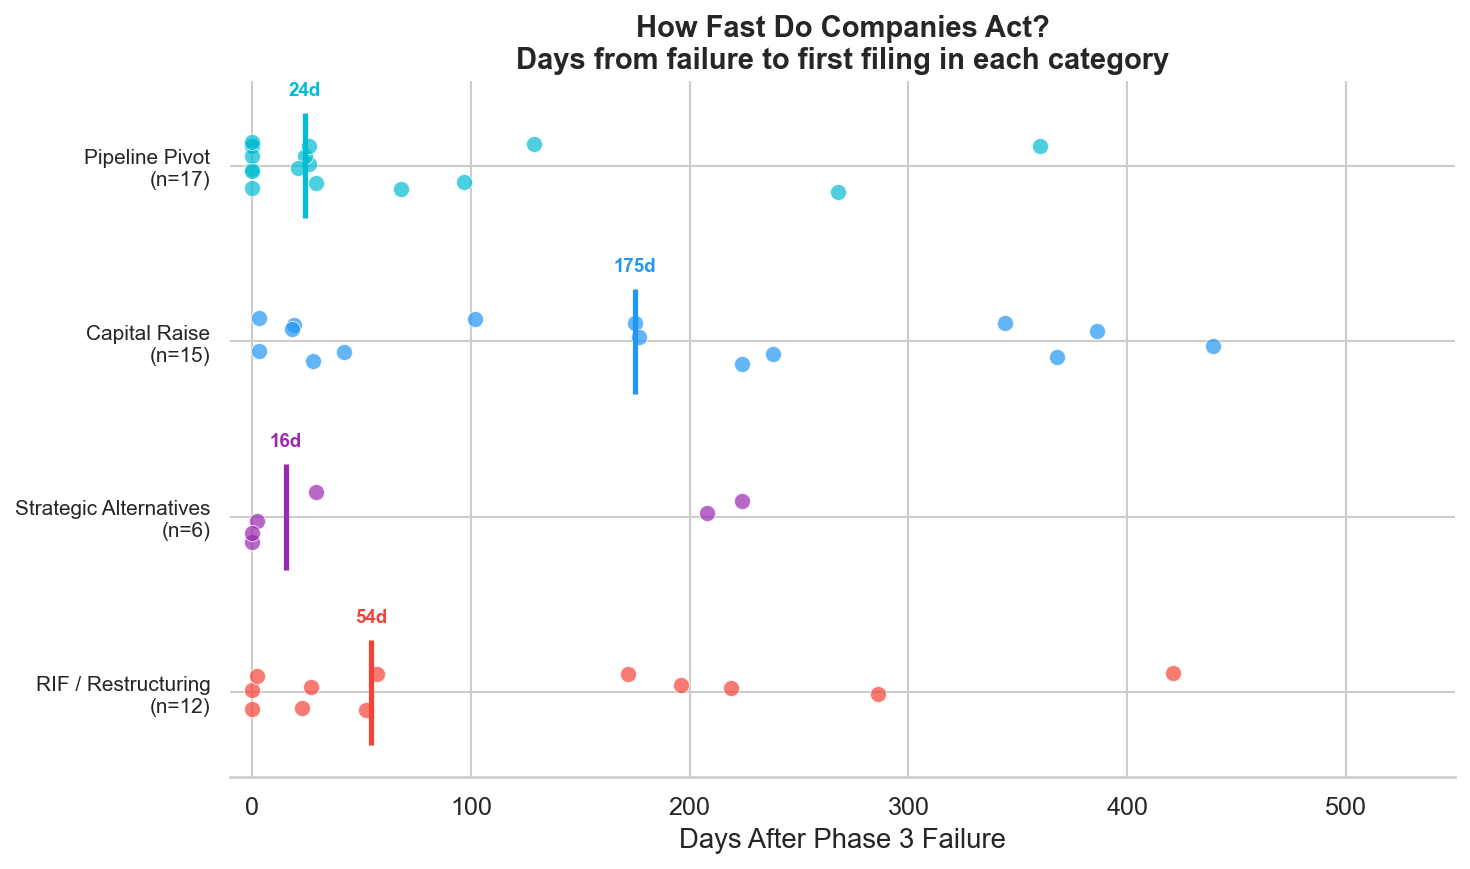 Figure 3: Days from Phase 3 failure to first filing in each corporate action category. RIF/restructuring and strategic alternatives announcements come first (median ~30 days). Pipeline pivots take longer (median ~6 months).
Companies don't wait. The median time from failure to the first restructuring action (RIF or strategic alternatives announcement) is roughly 30 days. Capital raises follow within the first few months. Pipeline pivots, such as advancing a backup asset, filing a new IND, or signing a collaboration, take longer, with a median around 6 months.
This sequencing makes sense. The immediate priorities are preserving cash (RIF) and signaling to the market that the board is engaged (strategic alternatives). The scientific pivot takes longer because it requires identifying the right asset, negotiating partnerships, and in some cases redesigning the clinical strategy.
4. Four Paths: Case Studies
The aggregate data tells the statistical story. The individual timelines tell the human one. We selected four companies that exemplify each archetype.
The Cut and Pivot: Prothena (PRTA)
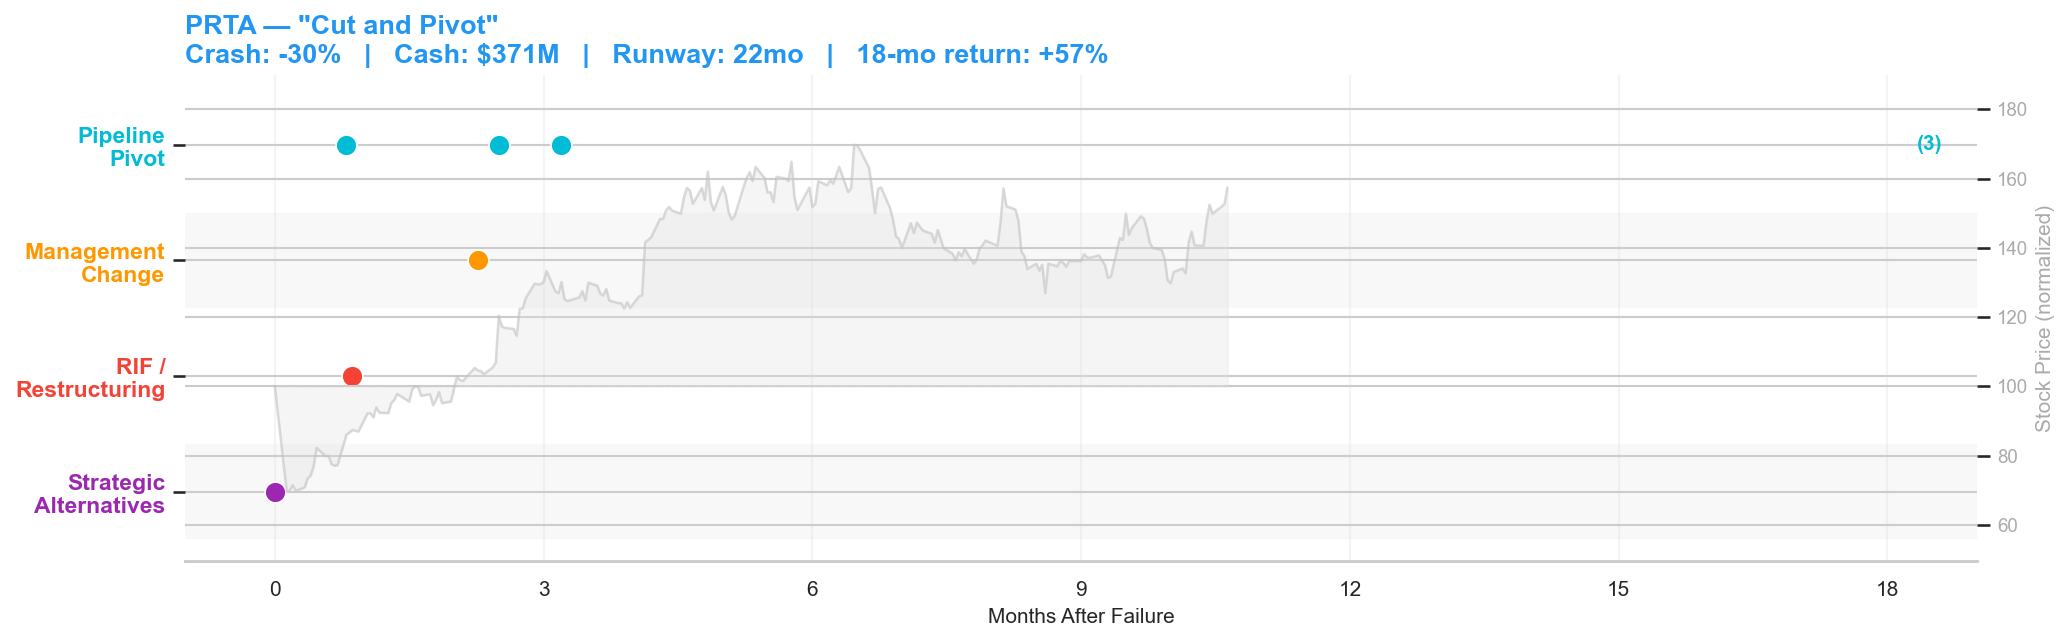 Figure 4: Prothena post-failure timeline. Crash: -30% | Cash: $371M | Runway: 22 months | 18-month return: +57%.
Prothena's Phase 3 AFFIRM-AL trial for birtamimab in AL amyloidosis failed on May 23, 2025. The stock dropped 30% to $4.58 on 5x normal volume. At the time of failure, Prothena had $371 million in cash and 22 months of runway, a strong balance sheet for a company that just lost its lead program.
The company moved immediately. On the same day as the failure announcement, Prothena disclosed it would "evaluate with its financial advisors business options in the best interest of its shareholders" and signaled a substantial workforce reduction. Three weeks later, on June 18, the company formalized the restructuring: a 63% reduction in workforce, with the Chief Regulatory Officer and Chief Business Officer among those departing.
But Prothena wasn't a single-asset company. Within a month of the failure, the pipeline started delivering. On June 16, Roche announced it would advance prasinezumab, a Prothena-partnered antibody, into Phase 3 development for early-stage Parkinson's disease, citing data from the Phase 2b PADOVA study suggesting clinical benefit on top of symptomatic treatment. On August 6, Novo Nordisk announced it would advance coramitug, another Prothena-partnered antibody, into Phase 3 for ATTR amyloidosis with cardiomyopathy. By late August, Prothena was exploring partnerships to advance PRX012, a novel anti-amyloid beta antibody the company believed could significantly lower the risk of ARIA in Alzheimer's.
The stock recovered from $4.58 to over $10 within 10 months, a 57% return from the post-crash low. The "cut and pivot" playbook: cut costs immediately to extend runway, then let the diversified pipeline carry the valuation.
The Double Down: Cytokinetics (CYTK)
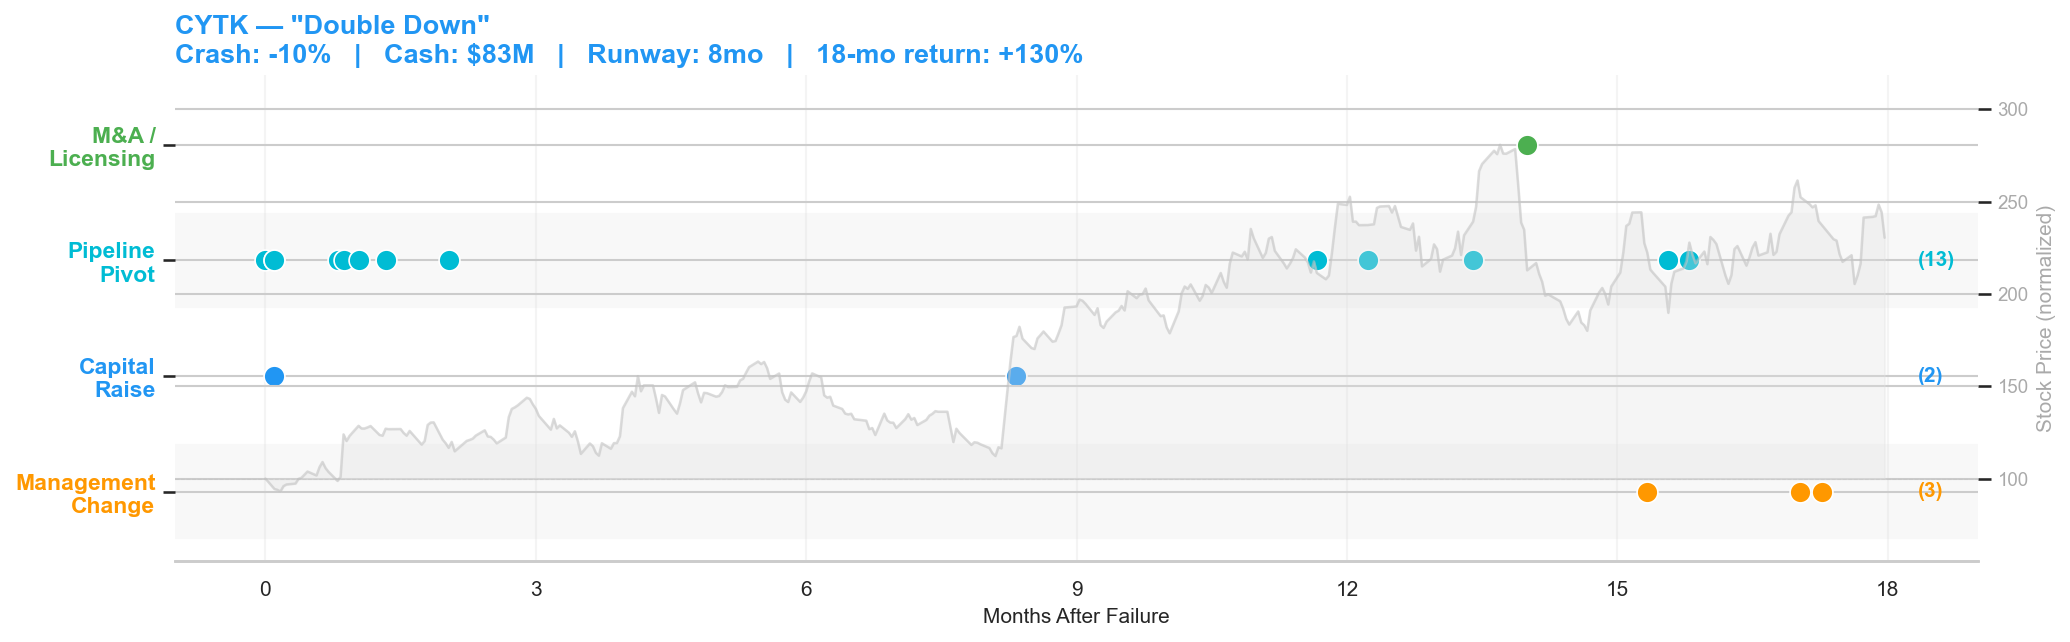 Figure 5: Cytokinetics post-failure timeline. Crash: -10% | Cash: $83M | Runway: 8 months | 18-month return: +130%.
Cytokinetics' Phase 3 trial of reldesemtiv in ALS failed on November 13, 2020. The stock dropped 10%. With $83 million in cash and only 8 months of runway, Cytokinetics was in a tighter spot than Prothena, but the company's response was the opposite of retrenchment.
On the same day as the failure, Cytokinetics filed an 8-K highlighting its ongoing collaboration with Astellas Pharma to research and commercialize novel cardiac myosin modulators. Three days later, another filing disclosed that the company had closed the sale of certain payment rights for $85 million, an immediate cash injection. Simultaneously, the company announced it was "considering potential advancement of reldesemtiv to Phase 3" despite the initial failure, pending regulatory interactions.
What followed was a sustained pipeline blitz. Over the next 18 months, Cytokinetics filed 13 8-Ks classified as pipeline pivots: advancing omecamtiv mecarbil in heart failure, developing CK-274 (aficamten) as a next-generation cardiac myosin inhibitor for hypertrophic cardiomyopathy, initiating the SEQUOIA-HCM Phase 3 trial, and licensing omecamtiv to Ji Xing Pharmaceuticals for Greater China. In January 2022, they secured a $300 million development funding loan.
The stock went from $16.52 at the post-crash close to over $38 within 18 months, a 130% return that vastly outperformed the XBI biotech index over the same period. Cytokinetics never flinched. The ALS failure was a setback for one program in a multi-asset pipeline, and the company doubled down on everything else. The "double down" archetype works when you have multiple shots on goal and the conviction, and the capital, to take them.
The Death Spiral: Iterum Therapeutics (ITRM)
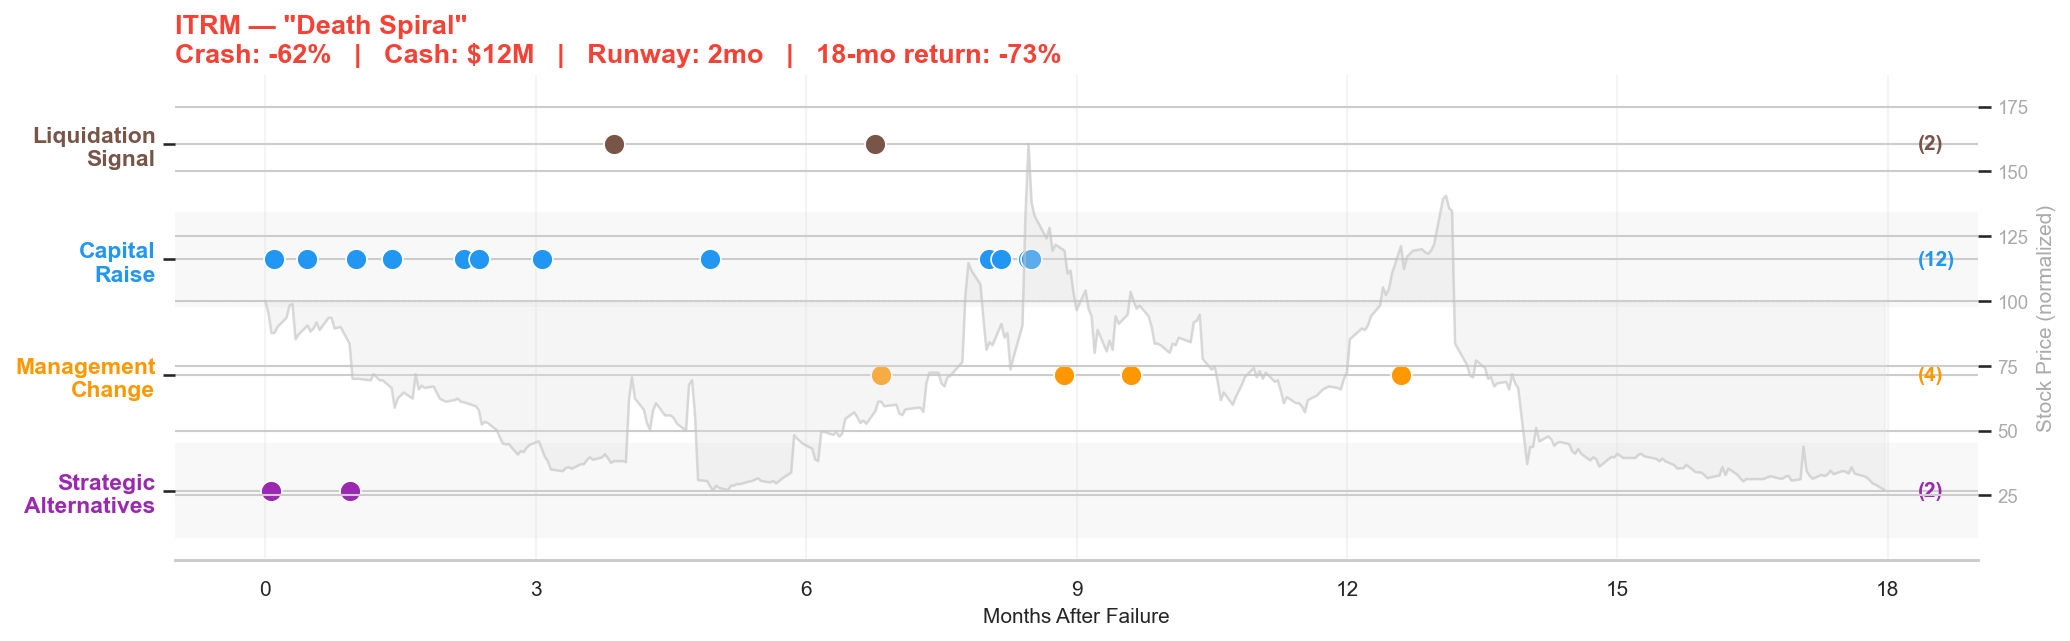 Figure 6: Iterum post-failure timeline. Crash: -62% | Cash: $12M | Runway: 2 months | 18-month return: -73%.
Iterum Therapeutics' Phase 3 trial of sulopenem for urinary tract infections failed on June 1, 2020. The stock had already crashed 62%. With $12 million in cash and a $21 million quarterly burn, Iterum had less than two months of runway.
Two days after the failure, Iterum's 8-K told the story: the company was "evaluating its corporate, strategic and financial alternatives with the goal of maximizing value," including "licensing, sale or divestiture of the company's assets or proprietary technologies, a sale of the company, or other strategic transactions." This is the language of a company that knows it's in trouble.
What followed was a frantic scramble for capital. Over the next 18 months, Iterum filed 12 8-Ks related to capital raises: securities purchase agreements, a rights offering of exchangeable senior subordinated notes, registered direct offerings, warrant exercises, and share capital increases. Each raise bought a few more months, but the clock never stopped.
In September 2020, Nasdaq notified Iterum that it had fallen below the minimum bid price requirement. In December, a second letter warned that the market value of listed securities was also below compliance thresholds, and Iterum transferred from the Nasdaq Global Market to the smaller Nasdaq Capital Market. The Chief Scientific Officer resigned in December. A board director left in March. Another director departed in June.
The stock ended the 18-month window at $6.90, a 73% decline from the already-crashed level. The death spiral pattern: insufficient runway forces emergency capital raises at dilutive terms, which depresses the stock, which triggers listing compliance issues, which forces more raises. The 12 capital raise filings in the timeline chart tell the whole story. Each blue dot is another desperate attempt to keep the lights on.
Iterum's story has a coda that connects directly to Part 1. The company survived the death spiral, barely, and ran a second Phase 3 trial of sulopenem for UTIs. In January 2024, that trial produced positive results. But as we showed in Part 1's gap-and-fade analysis, the stock gapped up 28.5% at the open on the positive headline, then collapsed 31% through the session, closing down 14% on the day. After a 110% run-up into the readout, the market had already priced in success, and the holders who had been waiting for the catalyst took their profits. The same company, the same drug, appearing in both posts as a cautionary tale at different stages: first the failure and its aftermath, then the hollow victory.
The Zombie: Kodiak Sciences (KOD)
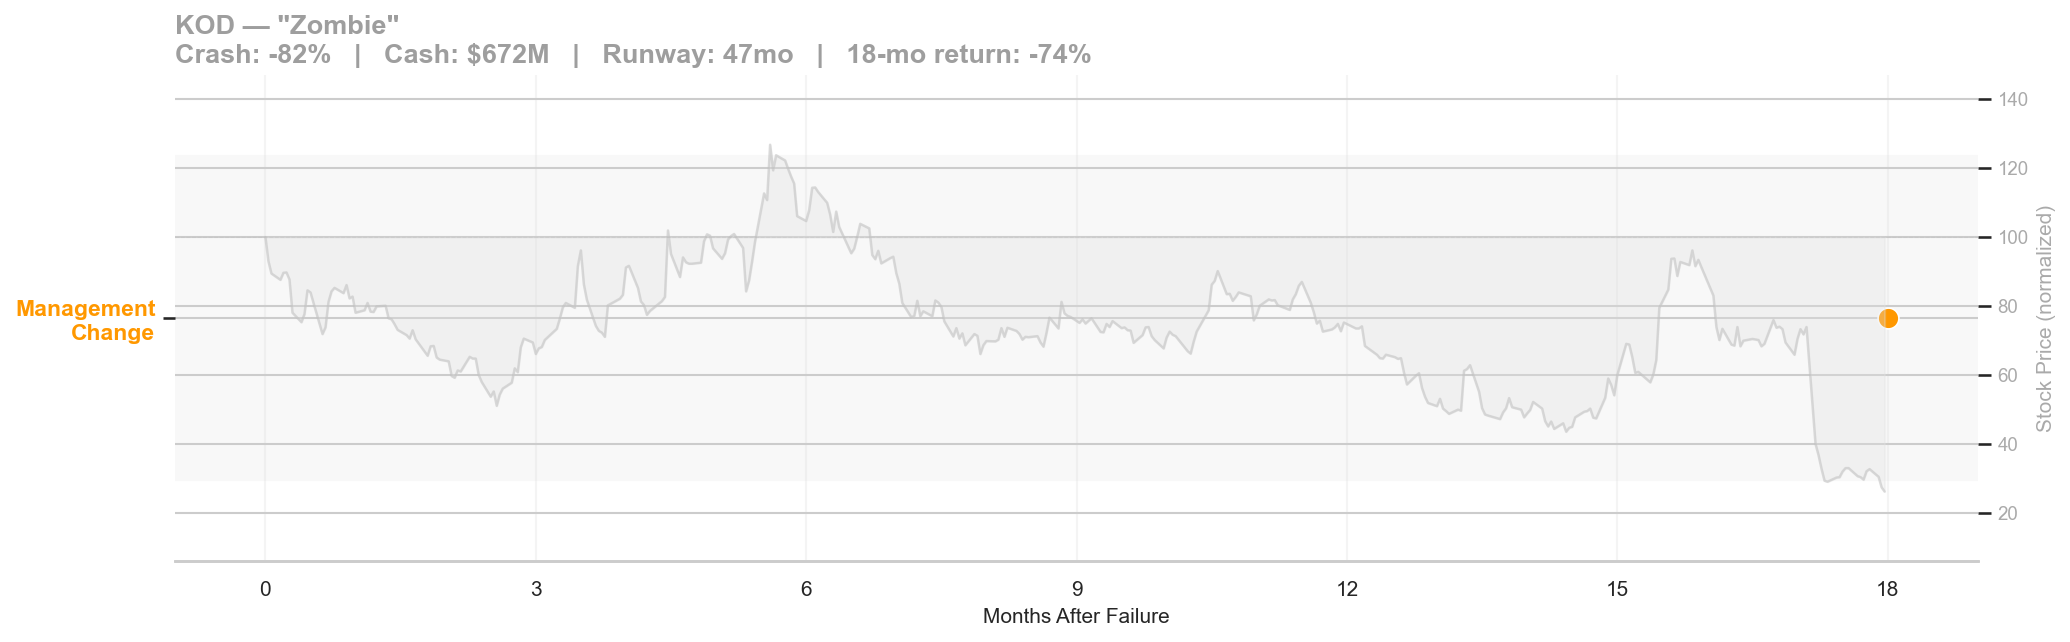 Figure 7: Kodiak post-failure timeline. Crash: -82% | Cash: $672M | Runway: 47 months | 18-month return: -74%.
Kodiak Sciences' Phase 3 GLEAM trial of tarcocimab tedromer for wet AMD failed on February 23, 2022. The stock crashed 82%, one of the largest single-day declines in our dataset. But Kodiak had $672 million in cash and a 47-month runway. The company could afford to do nothing, and that's exactly what it did.
The timeline chart for Kodiak is nearly empty. In 18 months of SEC filings, only one event was classified as a corporate action: the Chief Medical Officer resigned in August 2023, 540 days after the failure. No RIF, no strategic alternatives announcement, no capital raise, no pipeline pivot. The company sat on its cash.
The stock drifted from its post-crash level around $14 down to $2.59 over the 18-month window, a further 74% decline on top of the initial 82% crash. The market read the silence correctly: a company with $672 million in cash that takes no action for 18 months is signaling that it has no plan.
Kodiak eventually announced a second Phase 3 attempt at tarcocimab in November 2023 (captured in our dataset as a separate failure event when that too struggled). The zombie archetype is defined by the gap between resources and action: plenty of cash, no urgency, and a stock that bleeds value while the board deliberates.
5. Nobody Bought the Dip in this Sample
Perhaps the most surprising finding: zero companies in our dataset were acquired within 18 months of their Phase 3 failure.
This contradicts a common narrative in biotech investing, that large pharma swoops in to acquire companies cheaply after a clinical setback, picking up the technology platform, the team, or the remaining pipeline at a discount. In our dataset, it didn't happen. Not once.
The reasons are structural. Immediately after a Phase 3 failure, the company is in its most uncertain state. Is the platform viable? Is the data salvageable? Will the management team stay? Acquirers have no reason to move quickly when they can wait for these questions to resolve. The company's board, meanwhile, has a fiduciary duty to explore alternatives, which means any early-stage acquisition interest gets entangled in a formal strategic process that takes months.
The acquisitions come later, sometimes much later, and only after the company has rebuilt value. Consider Soleno Therapeutics (SLNO): Phase 3 failure in June 2020, stock crashed 36%, classified as a pivot in our dataset. Six years later, in April 2026, a definitive agreement was announced that Neurocrine Biosciences will acquire Soleno for $2.9 billion after its drug VYKAT XR generated $190 million in 2025 revenue. Neurocrine didn't buy the failure; they bought the recovery. We'll examine these long-arc recovery stories in Part 3.
For corp dev teams, the implication is clear: the window between the crash and the strategic alternatives announcement (typically 0-30 days) is too early to approach, and by the time the formal process launches, the company's expectations have reset upward. The real acquisition opportunity comes years later, after the company has either rebuilt or exhausted its runway, and the price reflects the new reality, not the post-crash despair.
6. The Recovery (Or Not)
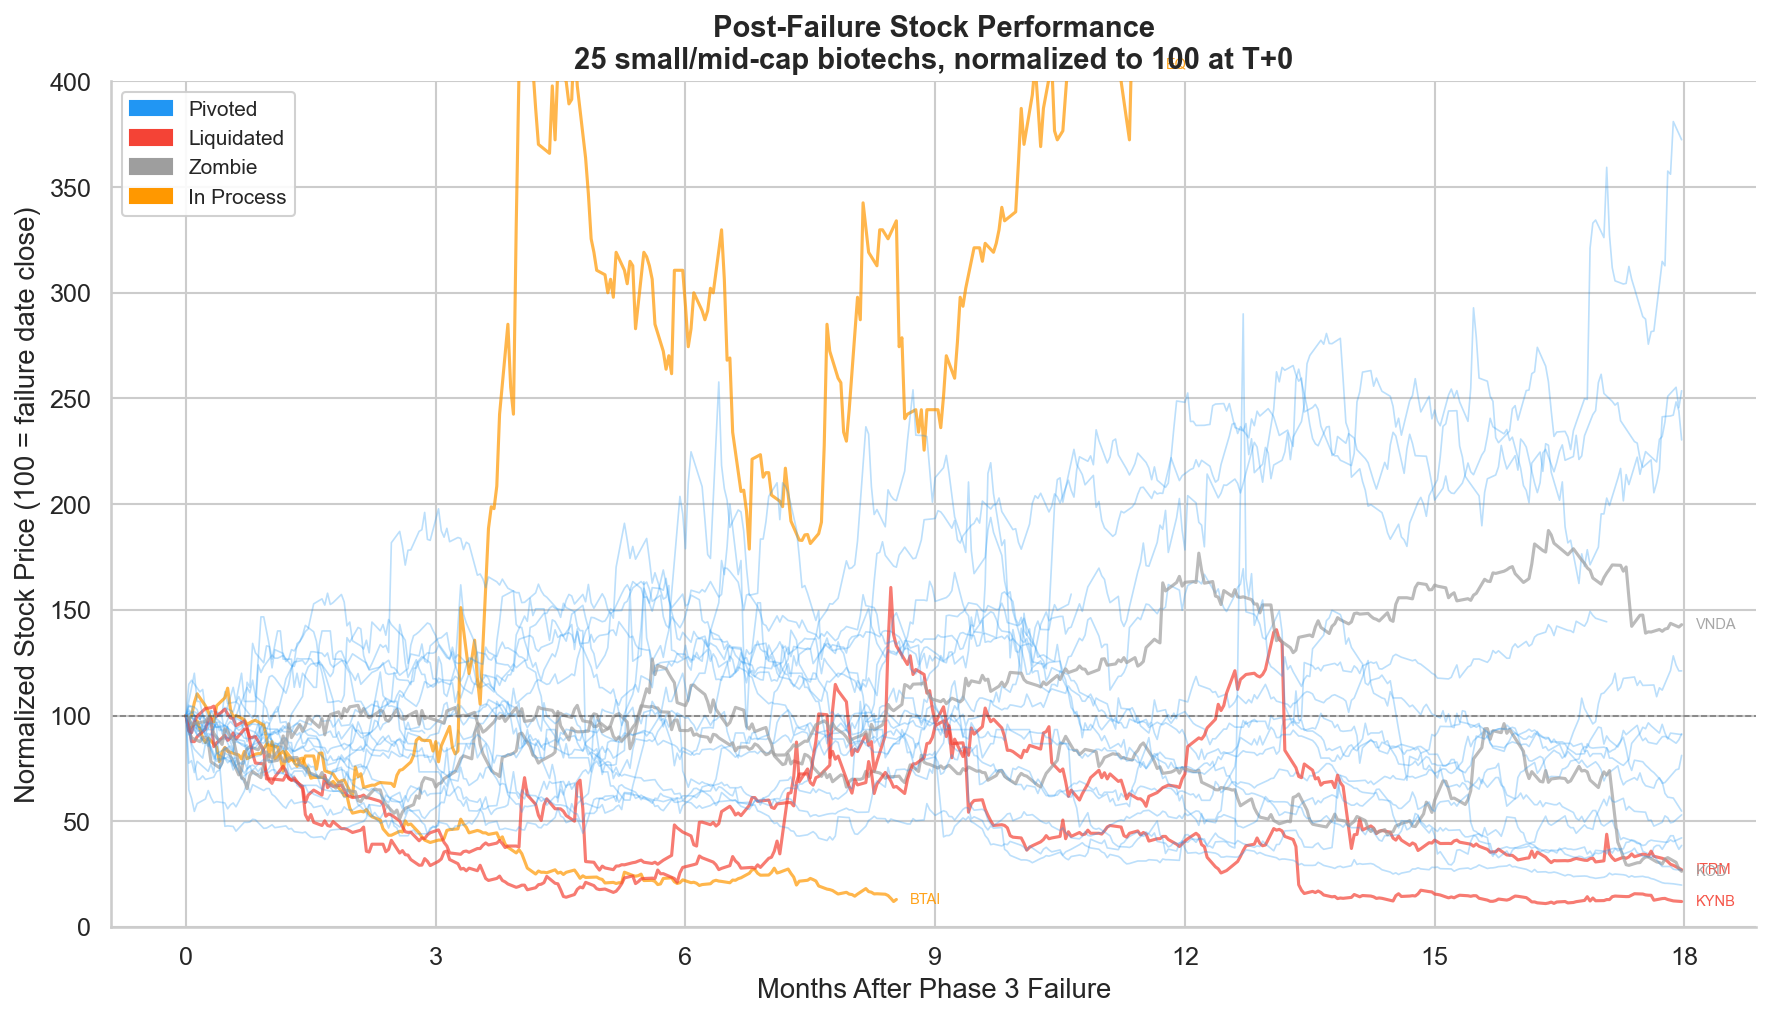 Figure 8: Post-failure stock performance for all 25 companies, normalized to 100 at failure-date close. Blue = pivoted, red = liquidated, grey = zombie, orange = in process.
The spaghetti plot shows the full range of outcomes. Each line tracks one company's stock price from the failure date through 18 months, normalized to 100.
The blue lines (pivoted companies) show enormous dispersion. Some recover to 200-350, more than doubling from the post-crash level. Others fade to 20-40, giving back another 60-80% on top of the initial crash. Pivoting is necessary but not sufficient; the quality of the pivot matters.
The red lines (liquidated) converge toward zero. The grey lines (zombies) drift sideways to down. The orange lines (in process) are too recent to resolve.
The wide spread in the pivoted category underscores a key point: knowing that a company will pivot doesn't tell you whether the stock will recover. CYTK pivoted aggressively and returned +130%. OCUL also pivoted with a RIF, Regeneron collaboration, and pipeline advancement, but still returned -45% over 18 months. The difference isn't in the corporate actions; it's in the quality of the backup assets and the market's assessment of their probability of success.
Takeaway
The conventional wisdom says Phase 3 failure means the company is done. The data says otherwise. Three out of four companies pivot. Nobody gets acquired in the immediate aftermath. Cash runway determines whether you have the luxury of a deliberate pivot or face the death spiral of emergency capital raises.
For investors watching a Phase 3 crash:
-
Check cash runway first. In this sample, sub-6-month runway often coincided with distress, while 12 or more months generally gave management more room to restructure and pivot.
-
Watch the first cost actions closely. Fast, meaningful headcount cuts are one of the clearest signals that management is trying to preserve runway for a real pivot rather than simply buying time.
-
Don't anchor on a quick acquisition. In this sample, the post-crash fire sale thesis never materialized within 18 months; acquirers appeared to wait for clarity rising from the chaos.
-
The quality of the pivot matters more than the pivot itself. Many companies took visible action, but outcomes still ranged from sharp recovery to continued collapse, depending on the credibility of the surviving assets and strategy.
For corp dev teams:
-
The first 30 days are usually too early for a formal acquisition push, but not too early to start the work. This is the period to map the board, assess runway pressure, identify surviving assets, and watch whether the company is preserving optionality or drifting.
-
In this sample, the first 18 months did not produce a single acquisition. Teams waiting for an immediate post-crash bargain may be looking in the wrong window.
-
The more actionable window may come later, after the company has either rebuilt credibility around a surviving asset or exhausted the limits of its pivot. In many cases, you are buying the recovery story once it becomes legible.
Methodology: Starting dataset: 25 deduplicated Phase 3 failure events from Part 1's SEC EDGAR event matching pipeline (small- and mid-cap, market cap <$10B, high-confidence match, negative trial outcome). Post-failure filings retrieved from the EDGAR submissions API (8-K, 6-K, 10-Q, DEFM14A, SC 13D/13G) for the 0-18 month window after each failure event. 8-K filings classified into corporate event categories using Claude Haiku LLM with keyword confidence boosting. Cash runway computed from SEC XBRL financial data (first 10-Q after failure). Stock prices from Massive.com, normalized to 100 at failure-date close, with excess return vs. XBI benchmark. Outcome classification validated against current company status via web verification.
Data pipeline: Solidus Platform. Clinical trial data: ClinicalTrials.gov. SEC filings: EDGAR. Price data: Massive.com. Filing classification: keyword matching with Claude Haiku LLM. Outcome verification: web research.
Need a custom competitive, IP, or diligence review for your team?
Solidus Bio delivers analyst-grade research for biotech companies and investors making high-stakes decisions.
Book a Scoping Call